RubyProf: Identify Your Pain Points
We all have been there: the site worked great in development but not so great in Production. Time to optimize! but… How to know what to optimize?
RubyProf is a fast code profiler for Ruby which helps you find pain points in your code by providing different measure parameters including call times, memory usage and object applications.
Show me the code!
require 'ruby-prof'
RubyProf.start

1.upto(100) do |number|
  if number % 5 == 0
    p 'Divider'
  else
    p number
  end
end

result = RubyProf.stop
printer = RubyProf::MultiPrinter.new(result)
printer.print(:path => ".", :profile => "profile")
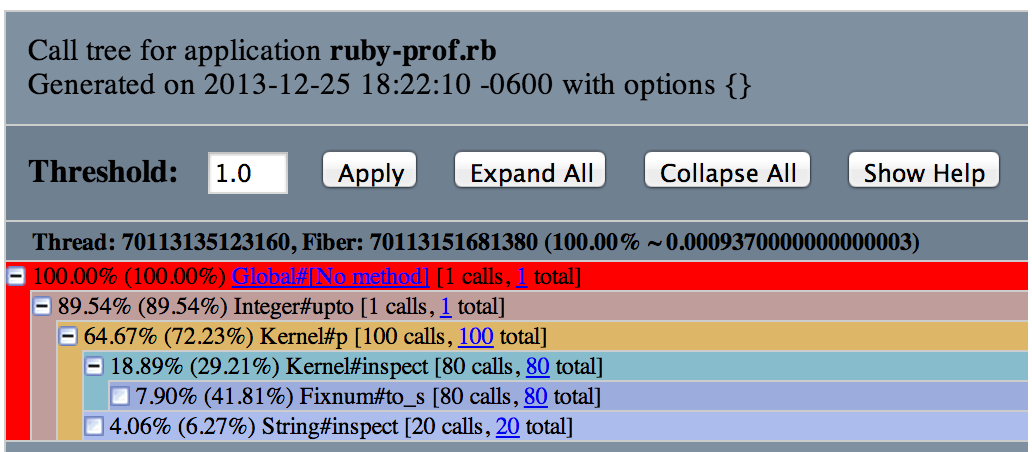
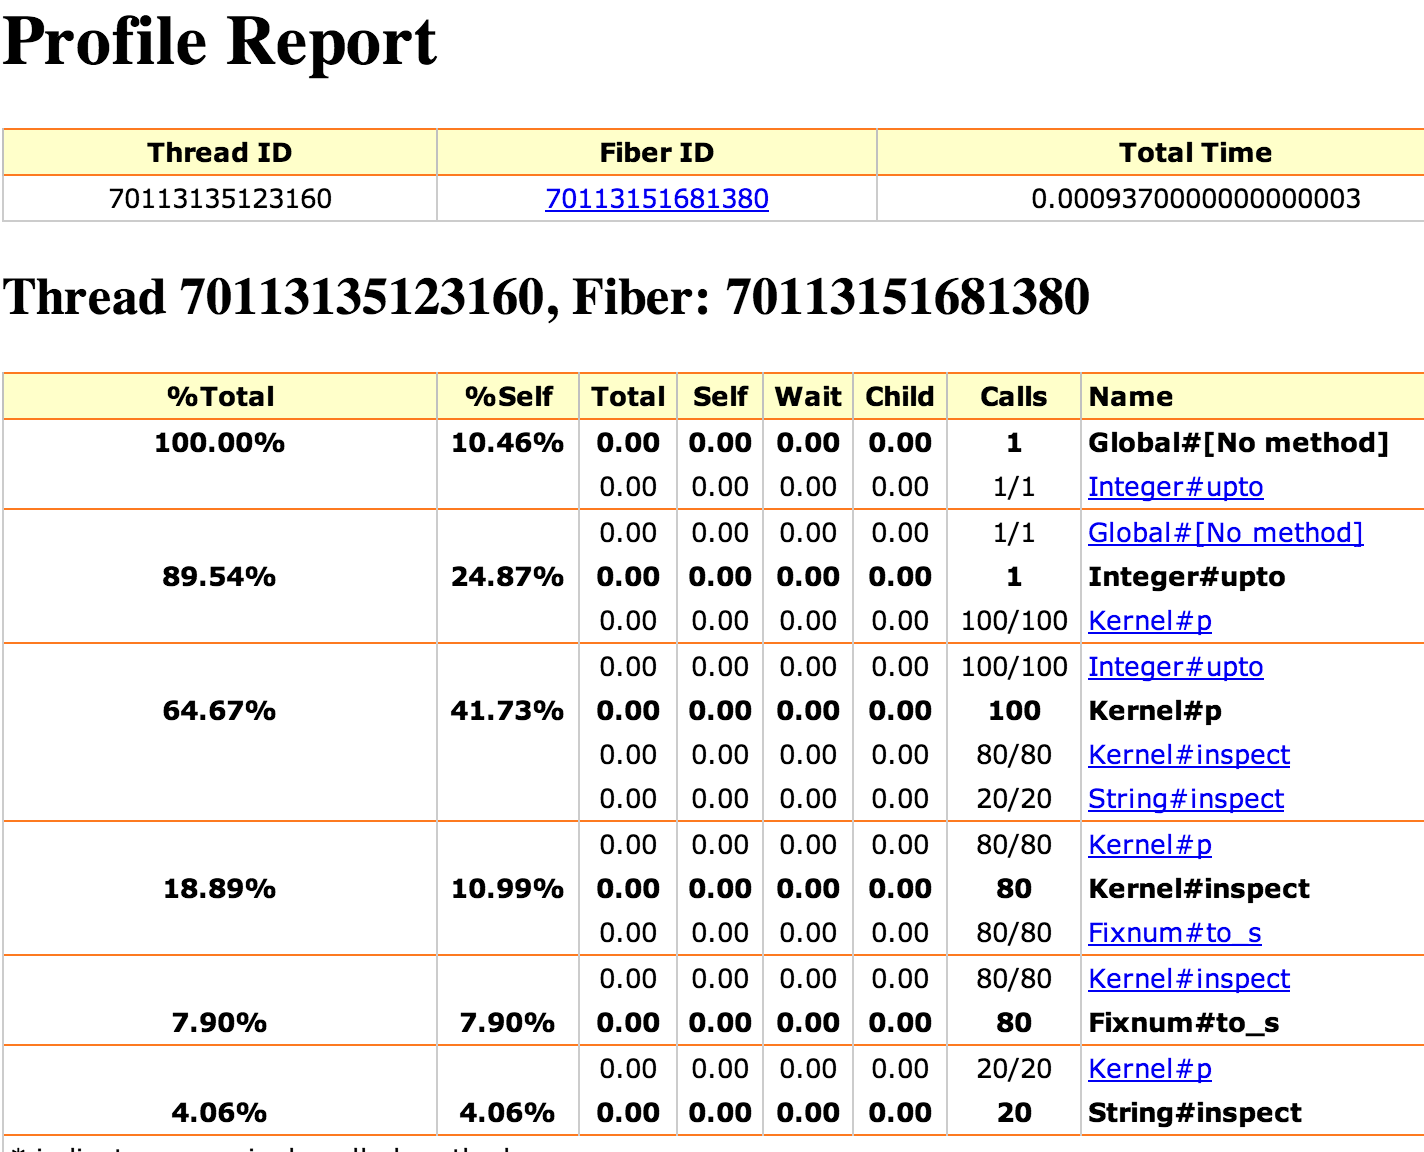
Now take a pic at the profile flat report.
Thread ID: 70113135123160
Fiber ID: 70113151681380
Total: 0.000937
Sort by: self_time

 %self      total      self      wait     child     calls  name
 41.73      0.001     0.000     0.000     0.000      100   Kernel#p
 24.87      0.001     0.000     0.000     0.001        1   Integer#upto
 10.99      0.000     0.000     0.000     0.000       80   Kernel#inspect
 10.46      0.001     0.000     0.000     0.001        1   Global#[No method]
 7.90      0.000     0.000     0.000     0.000       80   Fixnum#to_s
 4.06      0.000     0.000     0.000     0.000       20   String#inspect

         * indicates recursively called methods
